Chapter 5: Experimental Techniques
|
|
“An experiment is a question which science poses to Nature, and a measurement is the recording of Nature’s answer.” [Planck, 1949]
Experimental design determines whether a research report is read or ignored, whether a result is accepted or rejected, and whether a scientist is judged superior or inferior. Most scientists and many technicians can carry out an experiment successfully. An experiment’s value, however, depends not only on outcome but also on the skill with which it is designed. Fortunately, this skill, which develops with experience, also can be fostered deliberately. This chapter provides a variety of experimental tips, culled from the experiences of many scientists.
Like military planning, research planning has three levels [Beveridge, 1955]:
• tactics, the small-scale and relatively short-term planning of an individual experiment. The key question is ‘how’. Tactics must be considered in the context of
• strategy, the broader approach to the research problem, which involves an extensive suite of experiments. A strategy is most efficient if it is considered in the context of
• policy, the determination made by funding agencies and committees concerning which general problems are the most crucial in a science.
Like business planning, research planning should involve the following:
• risk analysis. What is the chance of success? What could go wrong and what would its impact be?
• risk management. How can I improve the chances of success? How can I avoid possible factors that would make the final result ambiguous or misleading?
• time analysis. How much time will it take for each step? How will potential problems affect this estimate?
• time management. How much control do I have over the amount of time required for each step? Where can I streamline the procedure without weakening the integrity of the experiment?
An intelligent person would never go to war or start a business without careful analysis of the factors above, yet most research planning gives them only brief attention. Usually we are so immersed in the details that we neglect the broader concerns. We may even claim that we are so busy doing that we don’t have time for esoteric planning. Careful planning of an experiment determines its value. If most experiments were to begin as a ‘gedanken’ experiment, a thoughtful anticipation of the likely progress and outcome of the experiment, then the few that are physically undertaken would be more likely to be key experiments.
“From the way a war is planned, one can forecast its outcome. Careful planning will lead to success and careless planning to defeat. How much more certain is defeat if there is no planning at all!” [Sun Tzu, ~500 B.C.]
Failure to consider the factors above creates some of the more common experimental pitfalls:
• underestimating the amount of time that an experiment will take. Underestimation is most acute when the planned experiment has never been done before (e.g., when one is designing new equipment for a novel experiment). Almost always, one’s overall time estimate is much shorter and less realistic than would be an estimate based on a list of the time requirements of individual steps. Most experimenters also fail to include time estimates for delays, setbacks, and unexpected problems, and their time estimates assume ‘production mode’ rather than the entire period from set-up to shut down. I routinely allow optimism to carry me into this pitfall, even though I recognize the wisdom of my wife’s rule of thumb: carefully estimate the time for each individual step, sum these times, and then double the total.
• lack of time management, resulting from taking each step as it is encountered. For example, running batch processes is usually more efficient than doing experiments in series. The wait time that occurs somewhere in most experiments can often be filled with another part of the experiment, if the process is planned as a whole. If I concentrate, I can keep three processes going at a time.
• lack of strategy. Even a tactically brilliant project can be strategically ineffectual or foolish; the best example is the Japanese attack on Pearl Harbor. The consequences of clever implementation of unfocussed research are less drastic: inefficiency and ho-hum science. Many ingenious experiments contribute little, because of insufficient attention to overall strategy. Too many experiments are selected merely because they are obvious or logical follow-ups to previous experiments. A more powerful selection strategy is to consider various possible experiments, then select the one that is likely to contribute most.
• lack of risk management. Often, surprisingly small changes in design or technique can profoundly affect the value of an experiment. Yet these refinements are neglected, because planning is short-circuited by optimism, lack of risk analysis, or enthusiasm to get started. In hindsight, the changes that should have been made are obvious.
“The winner does everything to ensure success before he fights. The loser rushes into combat without adequate preparation.” [Sun Tzu, ~500 B.C.]
* * *
Observational versus Experimental Science
Many scientific disciplines are more observational than experimental. Within these research areas, only a few of the guidelines for experimental design in this chapter will apply. For example, in observational or descriptive branches of biology, ecology, psychology, anthropology, and astronomy, manipulation of variables is not always possible. With many natural phenomena one cannot control experimental conditions. Yet the basic elements of scientific method are identical to those used with other experiments: observations inspire hypotheses, which can be tested only with further observation.
Scientists generally use the term ‘observations’ as a synonym for ‘data’, whether or not the experiment actively manipulates the observed environment. This section, in contrast, focuses on that distinction. Unlike experimental science, much observational science is akin to the Chinese concept of wu-wei, or ‘not doing’. Wu-wei is a balance of active and receptive, an alertness coupled with a willingness to allow nature to unfold and reveal itself.
Throughout scientific history, some scientists have chosen this method of alert receptivity. Greek science was almost entirely observational; it sought order in the universe through observation, interpretation, and classification rather than through experimentation. Charles Darwin, as biological taxonomer on the Beagle, recognized patterns that allowed him to understand both the evolution of coral reefs and the process of biological evolution through natural selection. Within the science of geology, a more observational science than most, there are highly experimental fields such as experimental geochemistry as well as largely observational fields such as paleontology. The lack of experimentation in paleontology has not prevented the field from providing the age-dating foundations for most of the rest of geology, or from revealing a wealth of climatic and evolutionary information.
Observation is the primary method for understanding complex systems. Control of all possibly relevant variables in such systems may be impossible, and the theories may be so simplified that they cannot predict the observations reliably. In studying complex systems, the search for one phenomenon frequently reveals an even more interesting phenomenon.
The approach to observational science often begins qualitatively, as a search for an order that characterizes the system. Usually the researcher observes many variables, hoping to detect any patterns. These patterns or relationships may or may not be causal. If an apparent pattern is found, a suite of later observations can be designed to test its significance.
An observational science can evolve into a more experimental science, particularly when a new paradigm guides observations by imposing order on the complexity and indicating which parameters are important for study. Astronomy is a good example: for thousands of years it was purely observational, then it became capable of quantitative predictions such as the occurrence of seasons and eclipses. Since Newton, work in astronomy has been increasingly quantitative and theoretical. Even without the ability to affect the planets and stars, astronomical experiments can isolate variables and test hypotheses.
Unlike hypothesis-driven experimentation, with its limited choice of expected results, observational science often yields unpredicted results. While this can be advantageous, promoting insight and creativity, there also are drawbacks. Unexpected results often are overlooked or rationalized (see Chapter 6). A particularly challenging aspect of observation is the necessity of noticing absence of a phenomenon; absence can be as significant as presence. For example, consider Sherlock Holmes’s search for the perpetrator of a break-in:
“ ‘Is there any point to which you would wish to draw
my attention?’ [asked Inspector Ross].
‘To the curious incident of the [watch]dog in the night-time,’ [answered
Sherlock Holmes].
‘The dog did nothing in the night-time.’
‘That was the curious incident,’ remarked Sherlock Holmes.”
[Doyle,
1893a]
Observational science has a bad reputation among some scientists, for several reasons. First, it cannot change experimental conditions as some other fields can. Second, its initial stage is often ‘just’ data gathering, a ‘fishing expedition’, because the phenomenon is still so incompletely understood that few hypotheses are available to channel observations. Third, and probably most important, the initial stage of most observational sciences is qualitative -- subjective -- not quantitative. Often the system is so complex and so many parameters can be measured quantitatively, that the scientist cannot discern which characteristics should be measured. I suspect that astronomy enjoys a much higher reputation than clinical psychology among scientists because it has progressed farther along a continuum, which begins with overwhelming complexity, progresses to pattern recognition and qualitative hypothesis testing, and culminates in quantitative testing of theoretical models.
Some scientists whose research is amenable to carefully designed experiments think that any research lacking such control is ‘less scientific’ than their own research. Nothing could be farther from the truth, and one should beware the assumption that the same standards for scientific method apply to all types of science. “If one has only a hammer, one tends to look at everything as if it were a nail.”
“More discoveries have arisen from intense observation of very limited material than from statistics applied to large groups. The value of the latter lies mainly in testing hypotheses arising from the former.” [Beveridge, 1955]
The following late 19th-century experiment by naturalist J. Henri Fabre [Teale, 1949] is worth a detailed description because it illustrates both the power of observational techniques and the remarkable impact that the subtlest experimental intervention can have on the value of a suite of observations. It should be noted that Fabre tried several similar, unsuccessful experiments before he recognized an emerging opportunity and seized it.
To what extremes can animals be enslaved by instinct? Fabre investigated this question by studying the pine processionary, a moth caterpillar that leaves a silky thread behind it as it travels. Nearly always, it chooses to follow existing silky paths, laid down by other pine processionaries. Usually this strategy is valuable for survival, leading each individual among the established food supplies of pine needles.
Watching a parade of pine processionaries approach the rim of a palm vase in his greenhouse, Fabre waited until the leader had completed a full circle around the rim. He intercepted the parade, by quickly brushing away all caterpillars and trails below the rim. That was the extent of his experimental intervention. He then observed the result, a continuous, leaderless string of caterpillars rimming the pot.
Because pine processionaries simply follow the silky trails left by others, the caterpillars kept going in a circle. Night and day, they kept going in the same circle. Only during the coldest part of the night did they slump. When they started again on the third day, they were huddled in two groups. Two leaders started the march around the rim, but soon the two groups combined into a continuous ring. On the fourth day the first to wake had slumped off the track. It and six followers entered the new territory of the pot’s interior, but they found no food and eventually wandered back to the rim, retaking the circular path. On the fifth day, a leader and four followers strayed from the path and explored the outside of the vase, to within nine inches of a pile of pine needles. They failed to notice this food and wandered back to the rim. Two days later, now staggering from hunger, one wandered and found the pine needles. Eventually the rest of the group followed. The pine processionaries had circled hundreds of times over a seven-day period and failed to recognize the uselessness of their circular path. They followed instinct to the point of collapse repeatedly, surviving only by chance.
* * *
Fabre’s experiment above is a classic example of the power of seizing a scientific opportunity. Often scientists undertake carefully planned experiments, but occasionally chance presents them with an opportunity. Such opportunities are most common in the more observational fields of research.
For example, whenever an earthquake happens, teams of seismologists rush to the scene with their seismometers, in order to monitor the aftershocks. When the 1971 San Fernando earthquake struck, I was at Scripps Institution of Oceanography, less than 100 miles away. I failed to seize the opportunity: I slept through the earthquake. My advisor, in contrast, ran into the bathroom and looked into the toilet. He saw that the water was sloshing north-south. Because he knew that active faults lie north but not south of San Diego, he inferred that a major earthquake had just struck north of us -- in the Los Angeles region.
A few hours later, he and several other geologists (myself included) were driving near San Fernando, looking for the fresh fault scarp. At least that is what we were trying to do; actually we were stuck in a canyon in what seemed to be the world’s largest traffic jam, while earthquake-loosened pebbles bounced down the hillsides and pelted the cars below. I remember wondering whether seizing this opportunity might be the dumbest idea I had ever gone along with.
Seizing an opportunity has sometimes been used as an excuse for skimming the cream and discarding the milk. In Egyptology, for example, the early approach was to grab the spectacular, expending no time for ‘details’ such as careful documentation of the less glamorous debris or post-excavation restoration of the site environment. Now archaeological work in Egypt is more careful throughout each project [Cowell, 1992], because an archaeological site offers no opportunity for a second chance or replicate study.
Supernova SN1987A was a successful example of scientists seizing an opportunity [Browne, 1992]. This explosion of a star occurred so close to earth (‘only’ 160,000 light-years away) that it was visible to the naked eye. It was the closest supernova in the last 400 years, an astounding chance to exploit modern astronomical technology to verify popular but untested models such as that of neutrino flux. The challenge was that study of SN1987A required a very fast scientific response, because the supernova peaked in brightness only three months after it was discovered. Both astronomers and funding agencies bypassed existing plans and procedures, achieving a sudden burst of observation, confirmation, and modification of theories.
* * *
Equipment, not rare opportunities, is the mainstay of most experimental science. The applications, complexities, and costs of research apparatuses differ, yet several concerns and potential pitfalls are common to most equipment used in science.
Invention often follows technology. When new technology permits higher-resolution studies or a novel type of measurement, new perspectives often result. One should be alert for such technological developments, even if they arise from outside one’s specialty, because of the potential for cross-disciplinary applications.
New technology also has potentially serious pitfalls. First, fascination with the new and complex can prevent objective evaluation of a new device’s strengths and weaknesses. For example, as I write this, the most powerful of the supercomputers is the Cray. Many scientists are impressed with results from the Cray. Some claim that anything produced on it must be right, and that its calculations supersede those from other computers. In fact, all computer calculations are subject to the same pitfalls of programming error, rounding error, and invalid assumptions; the supercomputers merely allow faster completion of complex calculations.
Researchers often are faced with a choice between two pieces of equipment: an older and a newer model. Perhaps one already has the older type and is thinking of acquiring the newer version. Usually the newer design uses state-of-the-art technology and therefore is more expensive, more efficient, and more accurate. Will enough experiments be undertaken for the greater efficiency to justify the greater cost? Cost of experimenter time must be weighed against equipment cost. Similarly, one must weigh the option of obtaining more measurements with lower accuracy against that of fewer measurements with greater accuracy. The latter is more aesthetically pleasing but not necessarily the most practical solution, and simple statistical analyses can help in this comparison.
Occasionally investigators choose to design their own apparatus, perhaps because none is commercially available or because personally constructed equipment is more suitable or less expensive than commercial. Almost always, this design and construction takes more time than expected. Yet home-built equipment also has several advantages, such as intimate familiarity by the researcher. Wilson [1952] gives a detailed review of factors to consider when designing and building one’s own equipment.
Whether using old or new equipment, the most frequent equipment pitfall is trusting the equipment. Nearly all equipment needs standards and calibration, regardless of what the manufacturer may imply. The need for calibration is obvious with home-built equipment, but calibration checks are just as necessary for sophisticated, expensive equipment. Indeed, this pitfall is even more insidious with the newer, higher-technology equipment. Digital displays and direct computer interfacing of equipment do not assure reliability.
Precision and accuracy, once determined, cannot be assumed to persist unchanged. Both can be destroyed by equipment malfunction and by subtle changes in the experimental environment. For example, I once subcontracted to another lab for 400 chemical analyses. In examining the data and the replicate measurements of standards, I found that the final 25% of the analyses were worthless. A power cord had been replaced and the equipment was not recalibrated after this ‘minor’ change.
Creating or purchasing some standards, then occasionally running them to confirm equipment performance, takes trivial time compared to the span of routine measurements. In contrast, lack of calibration checks can mean that entire experiments have to be redone. If realization of data unreliability dawns after publication, the setback can affect an entire research discipline.
* * *
When designing a new apparatus for a suite of experiments, it is usually a good idea to build a prototype first. When beginning a novel type of experiment, it is usually a good idea to do a pilot study first. In both cases, it is tempting to skip this step ‘to increase efficiency’. Skipping this step is almost always a false economy, unless the new apparatus or experiment is only a slight refinement of a familiar one.
The experimental prototype is a routine step in applied science, where it provides a bridge between theory and routine practical application. Applied science usually has two scales of prototype: laboratory prototype and then pilot plant. Only after both have been tried does a company decide whether commercial production is viable.
The prototype is a less common step in basic research, although some of the same factors that encourage its use in applied science apply to basic science. The prototype allows feasibility study, detection of practical problems, and improvement of design parameters. It also permits identification and isolation of unanticipated factors that could affect the success or accuracy of the experiments. Consequently, far different standards and objectives apply to the prototype than to the final apparatus:
• The prototype is much less expensive and time-consuming to build than the final apparatus. Often it is smaller, less robust, and less streamlined.
• The prototype is much more versatile than the final apparatus. Modification is easier, parts can be exchanged, and ‘quick and dirty’ fixes are acceptable.
• Depending on the type of measurement, the prototype may have a smaller or larger range of measurement values than the final apparatus will need to have.
• Precision and accuracy may be lower on the prototype, and both are improved as problem variables are isolated. The prototype is not necessarily well calibrated, because we are probably more interested in sensitivity analysis than in accuracy of these results.
• Measurements may be more cumbersome and slower on the prototype than on the final apparatus.
A prototype is likely to be needed whenever equipment design is substantially modified. It can even be a worthwhile time saver when one is building equipment or an experimental setup similar to published ones and depending on rather scanty published details. It is better to discover that the author left out a ‘slight complication’ when trying out a prototype than in the midst of an experiment.
The pilot study is the procedural analogue to an equipment prototype, and many of the considerations above apply equally well to pilot studies. Different standards [Beveridge, 1955] concerning variables and their control apply to pilot studies than to the formal experimental series:
• One can use extreme values for a variable in the pilot study to see if they have any effect. If they do seem to have an effect, then the formal experiment can focus on the range of most interest for this variable. At that stage, higher accuracy and precision probably will be required. Indeed, statistical analysis of the pilot data can indicate how many measurements will be needed to detect the effect (Chapter 2).
• In some situations, many variables could have a significant effect, and it is not obvious which needs to be incorporated into design of the formal experiment. One can lump many variables in the pilot study. Of course, some caution is needed to prevent cancellation of the effect of one variable by the opposing effect of another. This approach is most effective if one knows the probable direction of the potential influence of each variable. If a composite effect is found, then formal experiments can be designed that will systematically isolate the effects of each variable.
Pilot studies can indicate whether a potential experiment is likely to be fruitful and how one should deal with the relevant variables. Pilot studies cannot substitute for a well designed formal experiment.
Prototypes and pilot studies are modes of scientific troubleshooting. Whether or not we expect problems, these techniques help us to avoid them.
* * *
Troubleshooting and Search Procedures
Troubleshooting is a familiar, intimate part of science. The trouble may involve computer hardware or software, malfunctioning equipment, or an experiment that is giving results that are unexpected and possibly unreliable. These and many other problems are solvable with established troubleshooting and search procedures. Yet the techniques are published in few places, and most of us react to encountered problems by thinking of only one or two remedies. Wilson [1952] considers troubleshooting and search techniques in detail, and the completeness of the following discussion owes much to his comprehensive treatment.
The foremost rule of troubleshooting and search is: keep records to avoid duplication of effort and floundering, to reveal any patterns in the troubleshooting results, and to make it easier to identify potential tests that you have overlooked. Keeping records is unnecessary for the first or even second attempted solution. As soon as troubleshooting extends beyond a few minutes, however, one should start jotting down notes of what has been tried and what it yielded.
The frustration implicit in troubleshooting can result in needless damage. Hippocrates was familiar with the problem 2000 years ago. His guideline, which could have supplanted later leechcraft, is still apropos: Primum non nocere; first do no harm. When diagnosing a medical problem, exploratory surgery is an acceptable last resort; autopsy is not.
A subtler manifestation of primum non nocere is the following question: is the object of the quest worth the cost of the search? Cost can take various forms, tangible and intangible. When cost is computed in dollars, this question is the daily quandary faced by NSF and the occasional topic of intense arguments, as exemplified by the debate over star-wars research.
If troubleshooting new equipment:
1) Remember the facetious saying, “If all else fails, read the manual.” Probably something is connected wrong, a setting is incorrect, or a step is being left out. The better manuals even have a section on troubleshooting.
2) If possible, run a standard that you know is supposed to work on this equipment. If the standard works OK, then how does your sample differ from the standard? If the standard doesn’t work either, then go on to the next step.
3) Examine all of the equipment for visible signs of damage.
4) Try to isolate which part of the equipment is malfunctioning. Some of the search procedures discussed later may help. Sometimes it is possible to swap out parts of the equipment. Some parts can be tried in isolation or in conjunction with other working equipment, and some circuits can be tested with a multitester (AC, DC, and resistance).
5) Scan the following sections for any hints that might be relevant.
6) Call the supplier or manufacturer, tell them that we have a problem with the new equipment, and try to get troubleshooting help over the phone. Why not do this first? Telephone help is fine, but if the call merely results in arrangements for a replacement requiring delays of days or even weeks, then a few minutes or even hours of preliminary troubleshooting may be justified. The supplier may suggest that returning the equipment for their evaluation is more practical than telephone troubleshooting, because that is easier for them. If so, remind the supplier that they claimed to be in business to serve you, not vice versa.
If troubleshooting equipment or an experiment that formerly worked fine:
1) Go back to previous data and identify when the problem began, then list all changes to the system that occurred at about that time. The cause of the problem is probably in the list.
2) Run a benchmark check: try to replicate a measurement or result that you have previously obtained and that you are reasonably certain is valid. If it replicates OK, then how does this sample differ from the problem sample? If it does not replicate, then what may have changed since the original correct measurement? If this test is inconclusive, then a second replication test may be worthwhile, using a sample with quite different characteristics.
3) Consider the following frequent sources of equipment problems: incorrectly remembered measurement procedures, blown fuse or circuit breaker, part failure, a corroded connection, supply voltage variations, and temperature-sensitive components or equipment response. The first three usually cause a complete failure, and the others often cause intermittent problems.
4) If none of the above help, then possibly you have an uncontrolled variable that is influencing the results. Methods for dealing with such variables are described later in this chapter.
* * *
Search is fundamental to scientific method. Search procedures can be used for finding objects and for troubleshooting problems. More generally, search is exploration-based research. Search procedures can provide a practical way of dealing with the complexity of nature. They can help one to focus efforts or scientific questions, in order to reduce them to a tractable size (Killeffer, 1969).
Most scientists are aware of most search procedures. Nevertheless, we often succumb to the pitfall of choosing the first search procedure that comes to mind, rather than deliberately selecting the most appropriate procedure. The following list of search considerations and techniques is largely based on a compilation by Wilson [1952]:
• Characterize the object of the search. List the characteristics of the search object, and for each characteristic consider whether or not the object differs from its surroundings.
“Kilimanjaro is a snow covered mountain 19,710 feet high, and is said to be the highest mountain in Africa. Its western summit is called by the Masai ‘Ngaje Ngai,’ the House of God. Close to the western summit there is the dried and frozen carcass of a leopard. No one has explained what the leopard was seeking at that altitude.” [Hemingway, 1940]
Characterizing the search object has been the nemesis of attempts to find the ‘missing’ mass of the universe. If, as many cosmologists previously expected, the universe is to collapse someday into an infinitely small point like that which began the big bang, then there must be enough mass in the universe to produce the required gravitational attraction. Yet only about 10% of this mass has been found to-date [Wilford, 1992c], even including both what has been observed and what has been extrapolated to exist. Imagine the challenge of searching for something when you don’t know what it is and you don’t know where it is. Remarkably, astronomers are finding at least some of this dark matter, by observing galaxies whose motions require gravitational forces far larger than the observed masses could generate.
• Pick the most efficient method of detection. For example, select a technique that sees the search object but not the surroundings. In picking the most efficient method, consider the effort, time, and money needed to acquire, set up, and employ each method.
Diamond hunter Gavin Lamont discovered a gigantic diamond-bearing kimberlite pipe in Botswana, although the entire exploration region was covered by 160 feet of surface sediments that contained no diamonds. He used one fact, one speculation, and months of perseverance. The fact was that even though diamonds are incredibly rare, they are accompanied by common indicator minerals garnet and ilmenite. Thus one should search for garnet and ilmenite first. His speculation was that the only way garnet and ilmenite could get to the ground surface from 160 feet down would be reworking by deeply burrowing termites. Therefore he ran a search pattern through hundreds of square miles, easily finding each termite mound sticking up from the flatlands, and examining the termite mound for the presence of the dark minerals garnet and ilmenite. When he finally found the indicator minerals, he sank a shaft to what later became a 4.5-million-carat-a-year diamond mine [Heminway, 1983].
• Before embarking on a major search, try to establish that the object really does exist in the area being searched. For example, do not spend a major effort taking equipment apart if the problem could be elsewhere (e.g., power fluctuations).
A friend of the Mulla Nasrudin found the Mulla crawling around outside at night beneath a lamp post. Of course he asked, “What are you doing?” “Looking for my key”, replied the Mulla. The friend asked, “Where did you lose it?” and the Mulla replied “In my house”. The exasperated friend asked, “Then why are you looking for it here?” The Mulla answered, “Because there is more light here.” [Sufi teaching story, e.g., Shah, 1972]
• Confirm that you would detect the object if you encountered it. For example, it might be feasible to use an artificial substitute and see if you detect it. Test your detection method at intervals to be sure that it is still working and that it has sufficient sensitivity. Conversely, find out if your test is so sensitive that it gives false positives, i.e. it claims that you have found the object when you have not. False alarms may be acceptable, if you have another test for the object that you can apply at each apparent detection.
On my last oceanographic expedition, we heard an introductory lecture on drilling technology, complete with a 70-pound, 1'-diameter drill bit as a visual aid. After the lecture, two women scientists saw that the drill bit had been forgotten. “Let’s put it in the men’s room and stick a toilet brush in it,” they decided, “No man will ever recognize it.” For more than a week, they were right.
• Keep a record of the search; ideally, flag searched areas so that they are readily distinguishable from unsearched regions.
• Search the most probable place first, then search places that are successively less likely to contain the object. Use specific criteria for estimating promising locations; do not just play hunches.
Meteorites are occasionally found, but until recently they were considered to be far too rare to search for. Now they are being found in record numbers in Antarctica, and scientists have even found eight that they think have come from Mars and several that definitely came from the moon [Gleick, 1992b]. The new success is due to letting natural processes concentrate the meteorites: they are found on top of the Antarctic ice, in environments that are undergoing ablation rather than precipitation.
• Search systematically. Haphazard searching can take just as long as a systematic search, yet search some areas several times and others not at all. At the end of a haphazard search one still cannot exclude the searched area. Most searches begin haphazardly, but once they become time-consuming, one should pause and plan a systematic search. Systematic searches are not necessarily inflexible, inefficient searches.
Paul Ehrlich’s hypothesis was that some substances are able to kill parasites without damaging the host. He systematically investigated 605 compounds without success; the 606th, salvarsan, proved effective against syphilis. [Beveridge, 1955]
• Distribute your available searching resources -- whether time or manpower -- appropriately in the different regions. For example, if several areas seem equally promising but some are much easier to search, search the easy ones first. If you will have to quit searching after a limited time, usually a detailed search of the most promising area is more effective than a widespread superficial search. If a little-known phenomenon or a totally new type of observation is being explored, the initial search should probably be a broad reconnaissance rather than a detailed examination of a small subset. Detailed focus is higher risk, until the reconnaissance establishes which parts of the whole are most likely to reward close-up studies.
• Use a convergent search procedure, if possible. Convergent searches employ feedback on whether they are getting closer to or farther from the object. This technique is feasible for questions such as “When did the equipment start giving strange results?” or “Where is the short circuit?” but useless for questions like “Where is the needle in the haystack?” When using a convergent search, it is better to overshoot than to undershoot; this is the tactic used in golf putting and in weighing (use large weights until overshooting, then smaller weights). The ideal search procedure eliminates half the possibilities at each step:
Consider the game of twenty questions, as employed in the old television show ‘What’s My Line?’ There are thousands of professions, yet the questioners were often able to guess the contestant’s profession. If one can design each yes/no question to cut the number of possible solutions in half, then twenty questions can sort out one choice from 1,048,576 possibilities (220). Twenty guesses or a million? Clearly a systematic search procedure such as this one can be extremely powerful. Unfortunately, most search problems cannot be cast in this form. Furthermore, the technique fails if one of the answers may be incorrect.
• Use a search method that indicates both direction and distance to the object at each search step. On the few occasions that this technique is feasible, it is extremely efficient.
An old parlor game begins with everyone except the subject selecting some object in the room. Then the subject attempts the seemingly impossible task of identifying that object. As he wanders around the room, he detects people’s involuntary reactions to his proximity to the target object.
• Consider the probability of missing the object even if it is in the search path. Decide whether it is more efficient to do a detailed search first or to do a quick reconnaissance first and, if unsuccessful, then do a slower search of the same area. Do not eliminate any area unless there is virtually no chance of having missed the object.
• Consider possible impacts of the search itself both on the object and on the difficulty of finding the object. For example, will the search technique preclude re-search? If so, we must be certain that the initial search does not overlook its objective.
Surprisingly often, the following technique helps to solve equipment problems: take the equipment apart and put it back together. Perhaps this procedure will reveal the problem (e.g., a corroded connection) or perhaps it will solve the problem without revealing it (e.g., a loose connection). This procedure is counterproductive, however, if one puts the equipment back together incorrectly and creates another problem; it is much harder to troubleshoot two independent problems than to identify one.
Searching for submarines requires one to consider the impacts of the search: the submarine may detect you before you detect it, and it will take evasive action. Naturalists have the same problem with finding wildlife. Hunters sometimes take advantage of this phenomenon by using beaters to flush the game.
• For multidimensional search problems, search one dimension at a time. For example, when searching an area of ground, run parallel lines, with minimal but finite overlap of swaths. For multiple independent variables, check one variable at a time. For example, when tuning several controls for maximum sensitivity, maximize response with each separately, then repeat the procedure if interactions are possible.
• Consider the possibility of the object being present or visible only intermittently. This possibility applies not to physical objects but to a problem or searched-for phenomenon. Intermittent phenomena usually require long-term monitoring rather than, or in addition to, a more conventional searching of different areas at different times.
• Consider the possibility that two independent factors are helping to hide the object. Would the search procedure be successful regardless of the relative importance of these two controls, or does it only help to identify one of them? These two-variable problems, like intermittent phenomena, can create baffling, frustrating search and equipment-troubleshooting puzzles. Somehow one needs to separate the two (possibly unknown) factors, as in the one-dimensional search procedure above.
When the search succeeds, minimize recurrence problems:
• prevent another loss of the object, or
• make the solution a permanent one rather than a temporary fix-up, or
•
make a permanent record of the solution or successful search technique, and
assure that this record does not have to be searched for. For equipment problems,
paste a label on the equipment describing the symptom and solution.
* * *
Each of the search tactics above can be invaluable on occasion. For particularly intractable search or exploration problems, it can be worthwhile to scan the techniques above, considering the appropriateness of each. Many search problems, however, can be solved by a relatively simple series of steps:
1) describe the problem thoroughly;
2) list the differences between ‘signal’ and ‘noise’;
3) evaluate the potential benefit of each difference for the current problem;
4) consider employing a discrimination of more than one difference, either
in series (first cut then final discrimination) or in parallel (simultaneous).
* * *
Problem: Find a Needle in a Haystack.
Hint #1: First, define the problem more thoroughly. Ask, “Why do you need to find it?” This is not just a smart-ass question. It is a recognition that there may be many ways to solve a problem, and individual requirements determine the optimum approach. Are you after the needle or a needleless haystack? Which is dispensable: the needle, haystack, or both? Is this a one-time or repetitive problem? Are you certain that the haystack contains only one needle? How critical is it that no mistakes are made?
What is the best way to find a needle in a haystack, given each of the following scenarios?
• Feeding this hay to your thoroughbred horse could give it a punctured stomach.
• The only possible supplier of hay for your thoroughbred-horse stable provides hay that sometimes is unavoidably contaminated with needles.
• You are doing some sewing, and you just lost your needle in the haystack.
• A valuable golden needle is lost in the haystack.
Hint #2: Before deciding on a technique, list the characteristics in which the search object can be distinguished from background:
needle
hay
metal
vegetable
silver-colored tan-colored
not flammable flammable
magnetic
nonmagnetic
denser than water floats on water
sharp
dull
rigid
flexible
etc. etc.
This listing reveals multiple possibilities that can be considered with the question of hint #1, to select the optimum strategy. A pitfall, however, is the possibility that the needle may be stuck into a straw and thereby exhibit straw-like properties.
Answers (not in order):
• Burn down the haystack, then sift through the ashes.
• Buy an airport X-ray machine and pass all hay through it.
• Throw away the haystack and buy another (hay is cheaper than time).
• Go get another needle.
* * *
Problem: Search for the Top Quark.
High-energy physicists, needing to test theoretical predictions concerning subatomic processes, attempted to detect a subatomic particle that they called the top quark. They wrote computer programs to scan through a very large number of potential events and discard most of them. The remaining events then could be examined more carefully, to see if they might be caused by the top quark. Effectively, hay was plentiful, and the needle was only hypothesized to exist.
A major concern in designing the computer program was the relative impact on the experiment of two types of errors. An alpha error is a false positive (calling a straw a needle). A beta error is a false negative (missing a needle).
As I write this, the top quark finally has been detected.
* * *
Tips on Experimental Design and Execution
“The general who understands the advantages of varying his
tactics really knows the art of war.
“The general who does not appreciate the need to vary his tactics cannot
turn natural advantages to account…
“The wise man considers both
favourable and unfavourable factors, the former to pursue his objectives and
the latter to extricate himself from difficulties.” [Sun Tzu, ~500 B.C.]
“In almost every game of chess there comes a crisis that must be recognized. In one way or another a player risks something -- if he knows what he’s doing, we call it a ‘calculated risk’.
“If you understand the nature of this crisis; if you perceive how you’ve committed yourself to a certain line of play; if you can foresee you’ve committed yourself to a certain line of play; if you can foresee the nature of your coming task and its accompanying difficulties, all’s well. But if this awareness is absent, then the game will be lost for you, and fighting back will do no good.” [Reinfeld, 1959]
“Genius … means transcendent capacity of taking trouble.” [Carlyle, 1795-1881]
Preparation, experimental design, experiment execution, data analysis, and interpretation are all essential aspects of most research projects. Earlier sections of this chapter discussed experimental design with minimal reference to these companion facets of research, but here we will consider experimental design in the context of the overall experiment. Drawing on useful summaries by Wilson [1952], Killeffer [1969], and Open University [1970], I list the main initial steps in a research project (from conception through experiment), along with tips and guidelines on successful execution of each step:
1) state the general problem.
• What is the objective? Focus on a specific hypothesis; don’t undertake a fishing expedition.
• Is the experiment necessary? Can the question that the experiment hopes to address be answered by simply evaluating the hypothesis and its implications critically? Can the problem be solved by finding relevant data that are already published? Is it merely a puzzle that interests you (a perfectly valid reason) or does it affect interpretation of other problems? If the latter, is it a minor or major factor?
• Can the problem be restated in a form that makes it more feasible to solve? Should one test a simplified perspective or include refinements? Does the problem need to be broken down into components that are tested individually?
• What assumptions are implicit in the experimental design? Could the outcome of the hypothesis test be affected by an invalid assumption?
• What is the crux of the problem, the critical unknown aspect? What is the crucial, decisive experiment? Don’t settle for one that is merely incrementally useful, but don’t reject all potential experiments as not decisive enough.
2) thoroughly review existing data on the research topic. Review evidence on the more general problem, to the extent that time permits.
• Methodically summarize assumptions, data, interpretations, and speculations of previous relevant studies. Include your evaluation of reliability and possible weaknesses of each.
• Identify the critical deficiency of previous work.
3) select the most promising experiment.
• Seek a compromise or reconciliation of critical needs with viable techniques.
4) decide how to deal with all relevant variables.
• List all known variables that might influence the result. Classify each variable as either: (a) controllable, (b) uncontrollable but with an approximately known value or known influence on the key dependent variable, or (c) uncontrollable and unknown in influence.
• Decide which variables are of greatest interest. Try to minimize effects of all other variables (e.g., by keeping them constant or by randomization).
• Select one of these tactics: (1) focus on only one variable and vary it systematically; (2) analyze several variables simultaneously through use of a factorial design; or (3) analyze several variables sequentially in a series of experiments.
A later section of this chapter, ‘Control of Variables’, discusses these options in more detail.
5) choose the equipment to be used, if any.
• Consider the relative advantages of buying, borrowing, and building equipment. Preparations and lead time are greatest for building, less for buying, and least for borrowing. Ability to tailor the equipment to your needs is greatest for building, less for buying, and least for borrowing. Costs are high for both building and buying compared to borrowing. Borrowing is OK for a few experiments but usually impractical for a protracted suite of experiments. Experiments on borrowed equipment tend to be done in binges, with less opportunity for intermediate analyses during experiments and for follow-up experiments.
• Before using equipment, learn its background theory, operations steps, operational considerations, and potential problems. Obviously, some compromise is needed between the ideal of comprehensive understanding and the reality of time constraints. Generating unreliable data and then troubleshooting can be much more time-consuming than learning how to operate the equipment properly and within its limitations. One need not become an electronics technician to use electronic equipment, but pitfalls abound for those who use equipment that they understand only minimally. For example, the dilettante may omit implied operations steps, use the equipment outside its design range, overlook variables that affect equipment results, and misinterpret results.
6) calibrate equipment, both before and during the experiment.
• Test the equipment before starting the experimental series. Do not assume that it can be trusted simply because someone else recently used it successfully. Their samples may have been subtly different, or the equipment response may have changed.
• Choose standards and a calibration procedure appropriate for the equipment, samples, and anticipated data range.
• Recalibrate after the equipment is repaired, moved, or changed, and after any substantial hiatus.
• Run calibration samples regularly, preferably in a randomized mixture with the experimental samples. If equipment response changes with time or warm-up, calibrating at the start or end of each day is insufficient.
• Run blanks if feasible.
7) include replicate measurements in your design, if possible. Normally it is unnecessary to replicate every measurement. Replicating perhaps 5% of measurements, on randomly chosen samples and standards, gives a good estimate of overall precision.
8) in the experimental design, never change more than one variable or experimental aspect at the same time (unless you are using a factorial design).
9) list the entire planned experimental procedure. Do not simply try to visualize the entire procedure in your head.
• Calculate how many measurements or samples will be needed.
• Visualize every step, imagine what could go wrong, and seek a way of avoiding the potential problem. Possibly the experimental procedure needs revision, or perhaps all that is needed is increased caution at key points. What affects precision at each step? What affects accuracy? Which steps must be done painstakingly, and which are more robust? The ideal of doing every step of every experiment as painstakingly as possible is not only unrealistic; it is a recipe for scientific progress that is so slow and inefficient that the scientist will have trouble keeping a job.
• Seek ways of streamlining the list of steps without jeopardizing the integrity and reliability of the experiment. Could some steps be done more efficiently as batch process rather than in series? Are there long wait times during which other steps can be done? Where are the natural break points for each day’s work?
10) do a gedanken experiment, a thought experiment, before the actual experiment. Try to predict all of the possible outcomes of the experiment, how you would interpret them, what the weaknesses would be, and what the alternative explanations would be for each interpretation. Can the experimental design be changed to provide a more diagnostic, less ambiguous interpretation of each result? Pretend that you are a reviewer, intent on finding a fatal flaw because the results are contrary to prevailing theory. Remember that the gedanken experiment takes up a small fraction of the time of the actual experiment. When writing up results, we usually wish that we had done some part of the experiment differently; often a more careful gedanken experiment would have helped.
11) avoid last-minute changes to the experiment, unless you have carefully thought through all of their possible implications.
|
|
12) use identification labels on samples. Use indelible ink for labeling, and assure that either labels cannot be lost or labeling is redundant. If samples are in containers and if feasible, label both the sample and container.
13) take methodical, detailed notes during the experiment.
• Do not trust your memory for anything. Remember that you may come back to these notes months later, long after short-term memory of temporarily obvious factors has faded.
• Do not use scraps of paper. Ideally, use a lab notebook; some researchers say that a lab notebook is essential. At least, use dated sheets of paper and either a 3-ring binder or manila folder.
• Sketches may be useful.
• Decide whether or not to use a check-list during the experiment.
• Prepare and use a standard form for routine measurements, both to facilitate later analysis and to assure that all relevant information is recorded.
• Note times of steps, sample ID’s, experimenter (if more than one), and anything else that remotely could be considered a variable (e.g., source and grade of chemicals) in later review of the experiment.
• Note units of all data. A frequent pitfall is to assume that the units are so obvious or familiar that you could not forget them.
• Note any changes to the experimental procedure or equipment.
• Document calibrations.
• Record raw data, not just corrected data, because you may decide later to use different corrections. Record correction equations, because you may wonder later whether or not you did all corrections properly. Raw data are better than corrected data, if the corrections are untrustworthy or of unknown accuracy. For example, in using ‘temperature compensated’ equipment, I have been confronted with the challenge of evaluating whether the compensation actually introduced error because of its inaccurate measurement of temperature.
• Record bad data, unreliable results, and abortive experiments, using obvious flags to avoid mistaking them for trustworthy data (e.g., draw a large X through them). Add a notation on why they failed. Possibly, later analysis will show that information can be salvaged from these discards. Certainly, one wants to minimize the chances of making the same mistake twice.
• Remember in note-taking that some ‘facts’ assumed during the experiment may later be rejected. Associated data therefore may be inaccurate or imprecise and need unanticipated corrections. Whether these corrections are possible probably will depend on completeness of the notes.
• Flag any unexpected observations. Immediately consider whether they may indicate a problem with experimental procedure. Later, consider whether or not they can offer a new insight (Chapter 8).
• In deciding whether or not to record something, remember how cheap paper is compared to the cost of redoing an experiment.
• Similarly, paper is too cheap to warrant tiny, crowded marginal notations that might later be overlooked or found to be unreadable.
|
|
• Keep and regularly update a backup of your most vital notes and data. Be prepared for the eventuality of losing notes, data listings, or data files. Take steps to postpone that eventuality: do not take prime data on airplanes as checked baggage; be cautious about carrying prime data around with you routinely; both lock and back up your personal computer; keep backups in a different room from originals.
14) protect your experimental setup, experiment, and samples from accidental damage by yourself or others.
• Make a sign such as “Experiment in progress, do not disturb” and display it whenever the experiment is untended. I have seen incidents where using a seemingly overcautious sign could have prevented heartbreaking setbacks.
• When leaving a shared computer while it is number-crunching or otherwise in use, put a sheet of paper saying “In use” over the screen or keyboard.
I know of incidents of janitors innocently discarding:
• data or samples stored in a container that resembled a trash can;
• delicate samples wrapped in Kleenex and left on a desk;
• boxes that were almost empty.
15) avoid minor changes during the experiment. They separate data obtained before and after the change with a gulf of ambiguous comparison.
16) before the experiment is completed, begin preliminary data reduction and analysis.
• Allow time to think about what you are observing, regardless of how busy you are just collecting data.
• Rough, first-order corrections and analysis, including back-of-envelope plots, are acceptable at this stage.
• Determine whether or not you are generating unreliable data.
• Seek clues to needed improvements (e.g., finding a major unremoved variable). While avoiding minor changes, consider the advisability of restarting the experiment with a substantial improvement.
• Beware of potential bias to subsequent results caused by expectations from the preliminary analysis.
• Do not let these preliminary analyses substitute for post-experiment, systematic data reduction and analysis.
• Some experimenters or their managers find it fruitful to write progress reports regularly during the experiment.
17) handle calculations scientifically:
• Omit meaningless digits. Usually the final result will have no more significant digits than the least-accurate variable in the calculation. Carrying one superfluous digit is preferable to omitting a meaningful digit. A propagation-of-errors analysis is even better.
• Average raw data rather than final processed data, to save steps.
• Check your calculations. If using a calculator, use a different keying sequence than for the initial calculation, to avoid making the same mistake twice. If using a computer, check results with a calculator for one or two of the samples. Computers usually make no mistake or make the same mistake for every sample, if they are correctly interpreting the input format of all of the data. However, exceptions exist (e.g., calculations that work OK for data values greater than zero but not for data less than zero).
• Ask yourself whether or not the result looks reasonable. In the old slide-rule days, quick-and-dirty estimation was essential; now, this skill is rare.
Subsequent experimental steps are less relevant to the subject of experimental design and can be left to other chapters. These include: analyzing data, interpreting the experimental results, drawing conclusions, comparing these conclusions to those of other studies, and designing a modified experiment to test the conclusions.
* * *
Pitfalls of Experimental Design
“Faulty execution of a winning combination has lost many a [chess] game on the very brink of victory. In such cases a player sees the winning idea, plays the winning sacrifice and then inverts the order of his follow-up moves or misses the really clinching point of his combination.” [Reinfeld, 1959]
When the exorcist arrived at the house, he almost immediately started upstairs to begin the exorcism. “Wait,” interrupted the attending priest, “Don’t you want to learn the personalities of the demons?” “There is only one,” replied the exorcist. [Blatty, 1972]
Many of the potential pitfalls to optimum experimental design are obvious from earlier parts of this chapter, particularly the section, ‘Tips on Experimental Design and Execution’. Most of these pitfalls, however, are manifestations of the same demon: a rogue, or uncontrolled, variable.
* * *
Rogue variables are a frequent scientific problem. Suspect such a problem when troubleshooting equipment or an experimental setup, if none of the initial troubleshooting techniques helps. Also suspect such a problem whenever an experiment gives surprising, unexpected results. Such problems are always a nuisance, but sometimes their solution can foster scientific insight.
“The notion of a finite number of variables is an idealization” [Wilson, 1952] that is essential to practical science. Most ‘relevant’ variables have only a trivial influence on the phenomenon of interest. Often, they have no direct causal relationship to this phenomenon or variable, but they do have some effect on one of the primary causal variables. Such variables are second or third-order problems that are ordinarily ignored. Usually the scientific focus is on identifying and characterizing the primary causal variables -- those that have the greatest influence on the phenomenon of interest.
In the so-called ideal experiment, the investigator holds all relevant variables constant except for a single variable. This independent variable is deliberately varied while measuring the resulting changes in a dependent variable. Simplicity gives power to such experiments, but they are based on the often dubious assumption that one knows all relevant variables. Usually, we hold as many relevant variables constant as possible and cope with the non-constant variables through randomization. Unfortunately, the variables that we can control are not necessarily the ones that are most important to control.
In Chapters 2 and 3, we considered statistical techniques for quantitatively estimating the influence of variables. Here the focus is on several methods for determining whether or not a variable is crucial. Selection of the most appropriate procedure depends on feasibility and on time and effort needed to remove or measure a variable.
Common techniques for dealing with a problem variable are:
• stabilization: Keeping a variable constant prevents it from influencing other variables. This approach is best for variables that are a disruptive influence (e.g., voltage or temperature variations), rather than scientifically interesting. Rarely, it is feasible to monitor the problem variable, then make measurements only when it has a certain value. The technique does not work for intermittent problems.
• standard sample: A control or standard sample is a way of coping simultaneously with abundant uncontrollable or even unknown variables that might otherwise bias the measurements or mask the target relationship. Repeated measurements of this standard indicate how much data variability is generated by other variables. Sometimes one must accept that the observations are relative rather than absolute, because of the biasing effects of uncontrolled variables. Often, however, a suite of standards can allow calibration of the observations. They also can enable comparison to measurements by other investigators.
• control group: Dividing the experiment into two groups can demonstrate the effect of a variable of interest, even when many uncontrollable or unknown variables are present. Use of a control group is standard in social sciences such as psychology, but it may also be useful wherever one must cope with several uncontrolled variables.
The two groups should be as similar as possible, except that the problem variable is missing from the ‘control group’ and present in the ‘experiment group’. Such an experiment is called a controlled experiment. Note that this term does not mean that the experiment is under control (almost all experiments are controlled in that sense), but that it employs experiment and control groups.
The two-group experiment described here is the simplest controlled experiment; often it is not the most efficient experiment. Multivariate experiments using a factorial design permit one to explore the possible effects of several variables and their interactions in one experiment, rather than in sequential experiments. Design of such experiments is described in most statistics books.
An essential ingredient of most controlled experiments is randomization. Random assignment of individual samples to the two groups avoids bias and permits statistical determination of confidence levels for the effect of the variable of interest. For example, drug tests routinely use a controlled experiment with randomization and double blinds: subjects are randomly assigned to receive either the drug or a placebo, and neither the subject nor the drug dispenser knows which type is received.
Understanding the effects of acid rain on lakes has been hampered by the complexity of lake systems and the very high variability among lakes. Thus even when a lake with rising acid levels undergoes ecologic change, it is not possible to establish causality between the two.
Recent experiments in Canada have been able to detect ecologic changes caused by only minor acidification. They demonstrated, for example, that acidification causes a decrease in species diversity without changing total biomass -- an observation consistent with the more general ecologic pattern that environmental extremes affect diversity but not necessarily numbers. The experiments used the following drastic technique: choose a remote region of Canada where lakes are plentiful, select a pair of environmentally similar lakes, make one of each pair a control and deliberately acidify the second lake, then monitor the changes in both [Luoma, 1992].
• randomization: If an experimental design randomly selects samples or randomly matches treatment to samples, then potential biasing effects of uncontrolled variables are converted into random unbiased error that can be averaged out. For example, time often is an influential variable, because instruments may drift or subtle changes may creep into the experimental setup. By randomizing the sequence of sample measurements, the investigator can prevent undetected temporal changes from biasing the result. Randomization is the most powerful tool for dealing with uncontrolled variables; it succeeds whether or not you are aware of their presence. Randomization is less efficient that the other methods, however, because it converts bias into random noise, rather than quantifying or removing bias.
• correlation: If you cannot control a problem variable but can measure it, measure and record its value at each data measurement. Later, crossplot the variable of interest versus this problem variable. This technique succeeds even if the relationship between variables is nonlinear. It has disadvantages (Chapter 3): both types of measurement may change as a function of time, leading to a noncausal correlation, or a time lag may obscure the relationship.
• artificial variation: Deliberately change the problem variable by more than it is likely to change normally, in order to estimate the conditions under which this variable is prominent, as well as its maximum possible effect. The advantage of this technique is its ability to detect effects that are ordinarily subtle, by exaggerating them. The main disadvantage is that ordinarily trivial effects can be misinterpreted as disruptive. When the relationship between two variables is highly nonlinear, artificial variation is a poor predictor of the normal relationship.
When Irving Langmuir was trying to develop a new light bulb, he knew that ideally its interior should have a perfect vacuum. Faced with the impossibility of attaining that ideal, Langmuir deliberately added different gases to assess their effects. He discovered the gas-filled (fluorescent) light. Langmuir [1928] said,
“This principle of research I have found extremely useful on many occasions. When it is suspected that some useful result is to be obtained by avoiding certain undesired factors, but it is found that these factors are very difficult to avoid, then it is a good plan to increase deliberately each of these factors in turn so as to exaggerate their bad effects, and thus become so familiar with them that one can determine whether it is really worthwhile avoiding them.”
Another example: if you suspect that changes in equipment readings are caused by a temperature-sensitive electronic component, remove the equipment housing and blast various components with either a heat gun (e.g., a hair dryer) or coolant gas, while monitoring equipment readings.
An alternative to artificial variation is to investigate naturally occurring extreme points. The advantage is the same: maximizing an ordinarily subtle effect, to evaluate its potential impact.
Numerous studies of type-Ia supernovae during the past several years have shown a consistent pattern of increasing redshift with decreasing apparent magnitude (i.e., greater speed at greater distance) that implies that the expansion of the universe is accelerating. This unexpected conclusion was not compelling, however. The observed pattern could also be produced by dust or chemical evolution. A single new data point, from a supernova with a redshift of 1.7, far beyond the 0.3-0.9 range of previous data, excludes the alternative ideas and confirms that the universe is accelerating [Schwarzschild, 2001].
• sequential removal: When more than one variable may be influential, remove the dominant one and look at the effect of the next variable on the data of interest. Then remove this variable as well, so that possible effects of additional variables can be examined. This technique works only when the problem variables are controllable and their relative importance can be estimated. Nevertheless, it can be quite valuable or even essential. For example, if you think that variables X1, X2, and X3 may be disrupting your readings of D as a function of A, then temporarily keep A constant and record variations of D, X1, X2, and X3. At this reconnaissance stage, these problem variables need not be controllable. If they are controllable, however, factorial design is a more powerful experimental technique: it allows us to both isolate and quantify the influence of these variables. A related approach is the method of residuals (Chapter 3): measure variations caused by the dominant variable, remove its estimated effects, then compare data residuals to second-order variables.
Studies of the causes of spread of the AIDS disease long ago established that most U.S. cases are attributable to homosexual or intravenous transmission. But does heterosexual transmission occur, and if it does, how abundant is it? One technique to examine these questions is clearly biased, yet it is apparently the best available. Any AIDS instance that could be either homosexually or intravenously transmitted is attributed to those origins rather than to heterosexual transmission, regardless of the relative abundance of heterosexual versus other encounters. Only cases in which homosexual or intravenous transmission are impossible are attributed to heterosexual transmission. Because (we think) heterosexual transmission is much less likely per encounter than are other forms of transmission, this accounting bias toward the dominant variables is considered to be acceptable [Hilts, 1992].
* * *
Problem: the Noisy Widgetometer
You need to measure some widgets on your new high-precision widgetometer. Before starting, however, you prudently run some standard samples and find that the precision and accuracy are far below what is advertised. In desperation, you connect the widgetometer to a chart recorder and let it run for 24 hours, obtaining the record in Figure 21. How do you interpret this record, and what techniques and experimental designs could you use to deal with the problem?
|
|
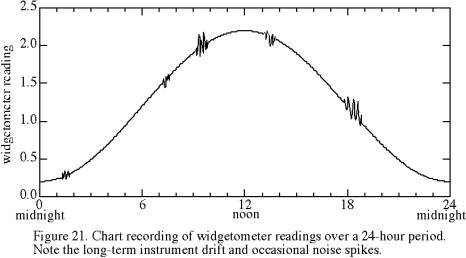
Answer: The instrument is exhibiting a daily drift plus occasional noise spikes. First priority is to try to identify and remove the drift. Second priority is to minimize the disruptive effects of any residual drift. Possible sources of daily cycles are daily temperature fluctuations and voltage fluctuations; try changing these and alternative variables substantially while running the chart recorder. If you can identify the variable, try to prevent it from affecting your measurements (e.g., voltage regulator), or quantify the relationship and monitor that variable during all measurements, so that you can apply a correction.
If the cause of the daily variations is unknown or unmeasurable, choose an experimental design that minimizes its effect. The most obvious is to take either a zero reading or a calibration-standard measurement along with each widget measurement, depending on whether drift is in zeroing or in sensitivity, respectively.
The cause of the intermittent noise spikes is likely to be quite elusive. Because they are sudden and short-lived, they could make some measurements much less accurate than most, and they could affect only one of a paired measurement. One approach would be to measure the zero or standard both immediately before and immediately after the sample. If the two zero/standard measurements differ by more than a predetermined threshold, reject this measurement set and do another.
* * *
Computation and Information Handling
Computers are wonderful productivity enhancers. Whether for word processing, figure preparing, calculating, or extracting the most information from data, computers are essential to modern science. When I was a young scientist, I would give a draft manuscript to a secretary for typing, have one or at most two rounds of revisions, and submit it. I would give a roughed-out figure to a draftsperson, flag the most glaring drafting errors for revision, and submit it. Now I do my own typing and drafting, and I do dozens of revisions! The process as a whole may be slower, but the final product is certainly more polished.
Basic computer literacy for scientists includes proficiency in all of the following:
• an operating system (Windows®, Macintosh®, Unix®, or
Linux®);
• word processing (e.g., Word® or Word Perfect®);
• spreadsheet analysis (e.g., Excel®); and
• a web browser (Netscape® or Internet Explorer®).
Most scientists also need one or more of the following:
• a graphics program (e.g., Kaleidagraph®);
• presentation software for slides and transparencies (e.g., PowerPoint®);
• image handling software (Photoshop® or Canvas®); and
• a statistical package (WinStat®, MINITAB®, SAS®, or SYSTAT®).
* * *
For some kinds of computation, speed is power. The current generation of computers is capable of solving more complex problems, involving more dimensions or variables, than were feasible even five years ago. The fastest vector machines, such as the Cray, are approaching their ultimate speed limits. Parallel processing, in contrast, is not bound by those limitations. Today’s largest computational tasks are massive because of the size of matrices or datasets, rather than because of the number of different kinds of computations. Such problems are well suited to parallel processing. The CM-2 Connection Machine, introduced in 1987, is an example of massive parallel processing: effectively it is 65,536 processors, each capable of associating both with its neighbors and with an individual data point [Boghosian, 1990].
Giant and expensive parallel computers are an exception to the overall trend toward small personal computers. An emerging alternative to the parallel-processor supercomputers is distributed computing. Ten to twenty high-performance workstations (e.g., Suns) are used simultaneously, via message-passing software and a local area net, to run different parts of the same problem. Effectively, the workstations become a virtual parallel computer, and they do so at night or in the background so that their metamorphosis disturbs nobody.
The acceleration of processing capability is generating opportunities for scientific projects that were previously impossible. Modeling can encompass complex systems (e.g., econometric models) and three dimensions (e.g., global climate models). Inversion can involve huge datasets (e.g., Human Genome Project) and three-dimensional, non-invasive tomographic imaging (e.g., CT scans, tomography of Earth’s interior). Image analysis of immense datasets is feasible (e.g., astronomy).
For most scientists, personal computers are sufficient and in fact superior to supercomputers. Scientists value control, and having one’s own computer, with a simple enough operating system to eliminate system managers, provides that control. Indeed, the major obstacle to further expansion of distributed computing may be the reluctance of individuals to relinquish a fraction of their supervision of their own computers.
* * *
Neither large nor small computers have removed the need for a vintage type of scientific calculation: back-of-the-envelope calculations. Computers have 8-digit or more accuracy, but the back-of-the-envelope calculation recognizes that the reliability of many calculations depends instead on huge uncertainty in one or two of the needed variables. Even the most advanced computer is naïve about pivotal concerns such as estimation and the difference between random and systematic errors. The scientist must provide the missing sophistication, either explicitly in a back-of-the-envelope calculation or implicitly in the data input to a computer algorithm. Chapter 2 addresses some of these concerns.
Late at night, sharing a Coke, feeling guilty about its 130 calories, my wife and I recalled the cryogenic diet, which we had seen long ago in a Journal of Irreproducible Results. Total dietary impact is not 130 calories, but 130 calories minus the calories required to heat the liquid from ice-cold (0°C) to body temperature (~35°C). A calorie, I knew from recently preparing an Oceanography lecture, is the heat required to raise 1 cc of water 1°C. A back-of-an-envelope calculation showed the benefit of a 12-ounce ice-water diet:
12 oz x ~35g/oz x 1 cc x 35°C x 1 calorie/cc°C ≈ 13,000 calories!
We realized that a ‘Popsicle diet’ (2 6-oz Popsicles) would be even better: 13,000 calories for warming from 0°C to 35°C, plus 32,000 calories (400 cc x 80 calories/cc) heat of transformation from ice to water! Clearly, there was a problem, and not one that a calculator or computer could solve. Days later, my wife found the answer: oceanographers use ‘small’ calories (1 g heated 1°C), but dietary calories are ‘large’ calories (1 kg heated 1°C). Neither anticipated the loss of sleep that a factor of 1000 could cause in a couple of hapless scientists.
When using calculators and personal computers, extra attention is needed concerning significant digits. Significant digits, or significant figures, are an implicit statement about the precision of a measurement. In general, a measurement of completely unknown precision is virtually worthless. Ideally, each measurement given in a publication would be accompanied by a calculated estimate of its precision. Precision estimates, however, generally require replicate measurements, which may not be available. The use of significant digits may have to suffice. The number of significant digits is equal to the number of digits that are reliably known, ignoring leading zeros.
Although the rules concerning significant digits are simple, few of the current software packages honor them. Some follow the conservative approach of assuming that all digits are significant (e.g., 1÷3=0.333333…). Some strip off trailing zeros whether or not they are significant; for example, a series of numbers accurate to ±0.01 might appear as 1.14, 1.1, 1.07, and 1. Most maintain a user-selectable constant number of digits to the right of the decimal place. None of these conventions is appropriate for publication.
* * *
The word computer is no longer appropriate. The proportion of computer usage devoted to computation is steadily decreasing. Many of the recent computer developments have had little to do with computation. Of particular interest to scientists is the extent to which computer networking is revolutionizing information handling.
Efficient information handling has always been an essential aspect of scientific method. Even the early days of science had more observations -- mostly irrelevant -- than a mind could encompass; an example is Leonardo da Vinci’s quicksilver mind and notes. Today, information handling is a mantra of our technological society. Are we witnessing another transient enthusiasm, or are we truly challenged to adapt or be left behind?
Research faces two information problems -- locating and organizing relevant information. These problems are relatively minor in the course of one’s own experiments, although they certainly are felt while writing up results. The real hurdle is in dealing with the vast published literature. All memories are fallible, especially my own. Where was I?
The first step in information handling is skimming or digesting a scientific publication. These days, we usually have a personal copy of the paper rather than the library’s, so we are free to mark up the paper with underlines and marginal comments. To organize information from several papers, many people simply group and rescan a stack of reprints. Others prefer to take notes, either on a pad or laptop. A virtue of the latter is easy reorganization, because association is essential to pattern recognition. Furthermore, typing is faster than writing, and the Find command is a great time saver.
Ambitious schemes for information handling tend to fail. First the scientist falls behind in entering data into the system. Later, the backlog is so great that the system atrophies.
Is information handling by computers more efficient than by scientists? For straightforward sorting, bookkeeping, and information archiving, the answer is yes. The quantity, or content, of science is doubling every five years, so the need for efficient data handling is undoubted. Use of the Internet and the World Wide Web is growing exponentially, and every scientist faces the question of how much to employ these valuable tools. Both publications and published data are becoming more available on the Internet. We can anticipate, as a result, increased awareness of relevant publications and more analyses of data by individuals other than the one who collected the data. Where better to exploit the Information Age than in the quest for answers to scientific questions?
Whenever one develops a hypothesis, the first step is to see whether or not it survives the test of existing data. If we decide that none of the previous relevant experiments was appropriately designed to provide a diagnostic test of the hypothesis, only then do we conduct a new experiment. Scientific progress does not imply, however, that the same person who generates hypotheses tests them. Already, many scientists are tapping the information river to produce papers that present no new data. Instead, they use a variety of published data to test hypotheses and develop syntheses. For the experienced Internet traveler, an easy path to scientific productivity is to read a newly proposed hypothesis and then extract data from the Internet to test it.
Scientists who rarely employ the Web may find that they are left behind, even in exploring their own hypotheses. Other scientists, however, are falling victim to the other extreme -- net surfing. Too often, Internet and the Web are used just for browsing rather than for goal-oriented information retrieval. The hallway refrain is “Did you see …?” And there is much to browse. Some scientists respond by devoting weeks to developing their own web pages. I, who published this book online rather than on paper, am in a poor position to criticize. Perhaps there is no cause for concern. Presumably, those whom I have watched wandering off into the Web will return.